VC versus Xcelsius challenge
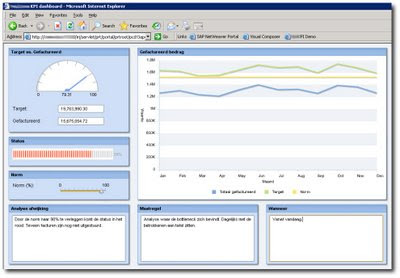
This week I had the change to ‘play’ with the Visual Composer again. Goal was to show a KPI dashboard on top of a BI query. With a gauge and a color (red or green) the status of the KPI had to be clear in one view. Besides that it had to be possible to change the ‘norm’ line online and to add comment on base of the results. It was quite fun to build. Challenges ? Only a few: Find out what BI query on our Discovery Server returned results that could be presented: Trial and error. Coloring the status bar: found in TechEd 2006 session CD151. Slider with the Norm and plotting this line in the graph: Also in CD151. Here is the result: Next to my playing around, two colleagues (Pieter and Xavier) created almost the same demo in Xcelsius . Their result: The customer was impressed by the Business Objects demo. They are interested and currently investigating project possibilities. Great news for the other team! Unfortunately not for me with my Visual Composer. But hey, I already have enough ...


